Diagrams and charts in answers
Checked against Inkling on , 3 min read
On this page6 headings
Figures are part of Pro, which a person switches on after you ask, at no charge. On Free, answers stay text: under a finished answer you’ll see Draw this as a diagram, which opens “Diagrams are Pro” — “Drawn from the sources, and yours to edit.” — with Request Pro access and Not now. Request Pro access
On the Pro plan, a Pro or Research answer can draw up to two numbered figures: a flowchart, a sequence diagram, a timeline, or a chart of figures from its sources that names the sources it used.
Before you start
- You need the Pro plan and an answer at Pro or Research depth. Quick answers never draw, and neither do direct answers, which have no sources to draw from.
- Inkling draws only when the answer has structure worth seeing, such as a flow, a hierarchy, a sequence of steps or a timeline. It is told to chart only numbers its sources state, so check a chart against the sources it names. Plenty of answers have no figure, and that is expected.
Ask for a figure
- Wait for the answer to finish. The rail beside it then shows Draw, with five chips: Flowchart, Sequence, Architecture, Timeline and Chart from data.
- Press one. It writes the request into the follow-up box, for example “Draw this as a flowchart”, and if the answer was Quick it moves the depth to Pro. Nothing is sent yet.
- Add anything only you know, such as “with the approval step”, and press Enter.
You can also ask in your own words in any follow-up. Architecture is drawn as a flowchart with grouped boxes.
What you’ll see
- Numbers. Figures are numbered Fig. 1 and Fig. 2 in the order they appear. The text refers to them by number, and a “Fig. 1” in a sentence takes you to the figure.
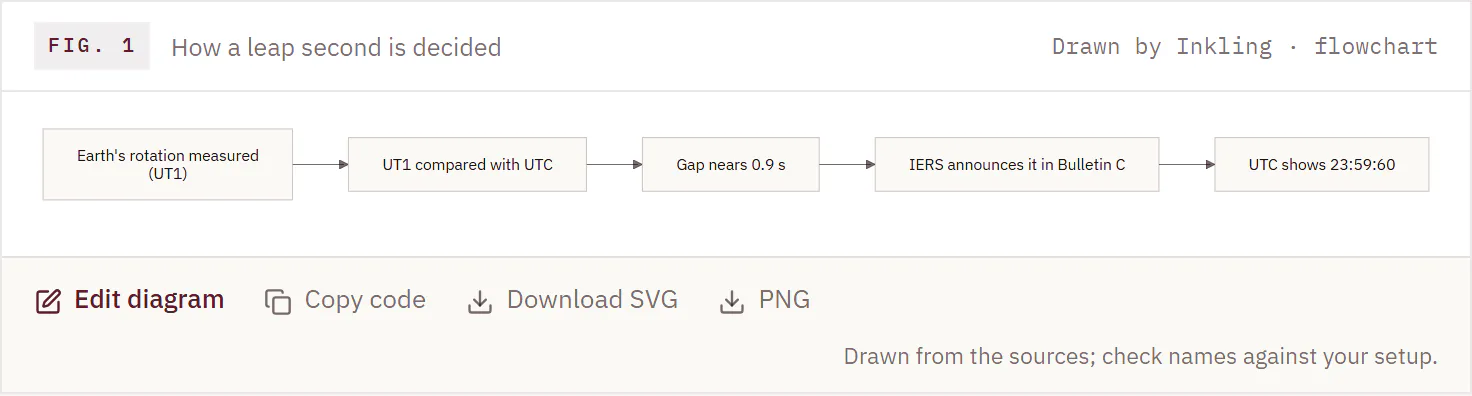
- A diagram is headed “Drawn by Inkling · flowchart” (or sequence, or timeline) and carries the note “Drawn from the sources; check names against your setup.” Its footer has Edit diagram, Copy code, Download SVG and PNG.
- A chart names the sources its numbers came from, such as “Chart from sources 4, 7”. View data opens a table of the numbers, and the footer has Download SVG and CSV. When the numbers come from more than one source, the chart carries a short caveat about what makes them hard to compare.
- The stamp above the answer counts them, for example “2 figures”. In a research report, Figures in the rail lists each one.
What Inkling can draw
| Figure | Types |
|---|---|
| Diagram | flowchart, sequence diagram, timeline |
| Chart | bar, stacked bar, grouped bar, line |
There are no pie charts.
Limits
| Free | Pro | |
|---|---|---|
| Figures in an answer | none | up to 2 |
| Depths that draw | none | Pro and Research |
| Size of one diagram | not applicable | up to 25 nodes and 40 connections |
| Size of one chart | not applicable | up to 5 series and 24 categories |
| Redraws in the editor | none | currently 50 a day |
Figures drawn inside an answer are not counted against anything. Only redraws in the diagram editor are; see Edit a diagram.
Good to know
- No source, no chart. A chart has to cite sources the answer actually read. If its citations don’t match, Inkling doesn’t draw half a chart: the numbers appear as a plain block labelled “chart data” instead.
- If a diagram doesn’t draw, its place reads “This diagram didn’t render — open the editor to fix it.”
- Safe to open. Diagrams are drawn as plain SVG and never run scripts.
- Figures travel with the answer. They appear on a page you share, where readers can’t edit them, and in Export PDF.